





Ever wondered what those dynamic visual patterns in your audio software actually represent? Understanding audio waveforms is essential for anyone working with sound, from musicians and producers to podcast creators and sound engineers, as they provide crucial insights into audio quality, volume levels, and potential issues.
Audio waveforms are graphical representations of sound that display amplitude variations over time. When you see a waveform, you're looking at a bipolar measurement with positive values shown above the center line and negative values below it. The wave's height indicates loudness (amplitude), while the pattern reveals information about frequency content.
Waveforms can take many forms, from simple line graphs to audio visualization bars that show loudness at any given moment. Mastering how to read and manipulate these visual sound signatures opens up new dimensions for audio creation and troubleshooting.
Whether you're trying to spot clipping in podcast recordings or create animated waveforms for your videos, this guide covers the essentials. Learning to use an audio waveform generator can also help you understand these signals in practical settings.
Key Takeaways / TL;DR
- Audio waveforms visually represent sound by displaying amplitude changes over time, making invisible sound characteristics visible.
- Waveform analysis helps identify audio issues like clipping, phase problems, and unwanted noise before they reach your audience.
- Digital audio workstations provide powerful waveform manipulation tools for precise editing, mixing, and sound design.
1
What Are Audio Waveforms And How Do They Work?
Audio waveforms visually represent sound, showing how air pressure changes over time. These patterns help us understand, analyze, and manipulate sound in applications ranging from music production to scientific research.
The Definition And Science Behind Audio Waveforms
An audio waveform is a graphical representation of sound that displays changes in air pressure over time. When objects vibrate, they create compression and rarefaction in air molecules, forming sound waves that travel to our ears. These audio waveforms serve as the backbone of sound engineering and editing.
The vertical axis of a waveform represents amplitude (volume), while the horizontal axis represents time. Higher peaks indicate louder sounds, while the distance between repeating patterns shows frequency (pitch). The science behind waveforms involves physics principles related to wave propagation.
Audio waveforms can be displayed in different ways, including the traditional oscilloscope view or spectrogram representations. Understanding waveform diagrams is essential for anyone working with audio editing, sound design, or acoustic analysis.
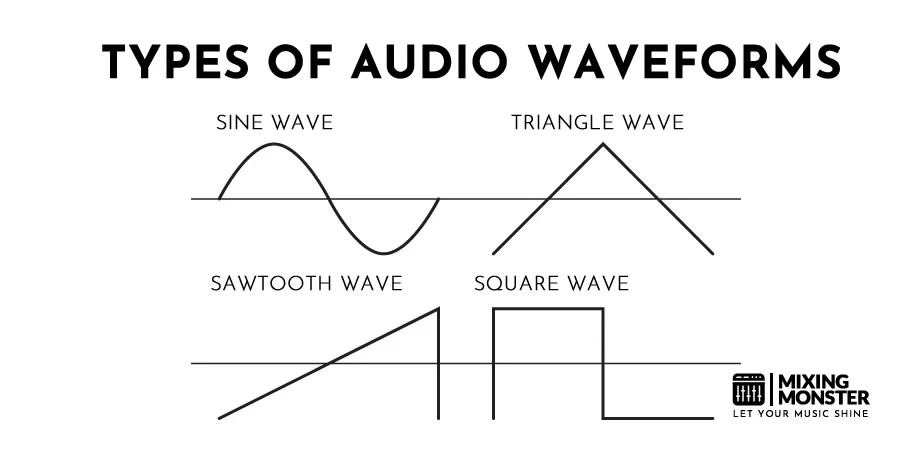
Types Of Audio Waveforms (Sine, Square, Triangle, Sawtooth)
Several fundamental waveform types exist, each with distinctive characteristics:
Sine Waves: The purest waveform type containing only one frequency with no harmonics. They produce a clean, pure tone and serve as building blocks for more complex sounds.
Square Waves: Characterized by abrupt transitions between maximum and minimum values, creating a distinctive "boxy" sound rich in odd harmonics. Square waves are common in retro video games and certain electronic music genres.
Triangle Waves: Feature linear rises and falls, producing a softer sound than square waves but with more harmonics than sine waves. They contain both odd and even harmonics but at lower amplitudes.
Sawtooth Waves: Characterized by a rapid rise followed by a sudden drop, creating a bright, buzzy sound rich in both odd and even harmonics. Sawtooth waves are popular in synthesizers for creating brass-like and string-like sounds.
Each waveform type has specific applications in sound synthesis and audio production. Many musicians use a sound wave generator to create these basic tones when designing new sounds for their projects.
How Digital Audio Systems Convert Sound To Waveforms
Digital audio systems capture sound through a two-step process called analog-to-digital conversion (ADC). First, microphones convert sound pressure waves into electrical signals (transduction). Then, these analog signals are sampled and quantized.
Sampling involves measuring the signal amplitude at regular time intervals, with the sampling rate determining frequency resolution. Industry standard rates include 44.1kHz (CD quality) and 48kHz (professional audio).
Quantization assigns each sample a binary value based on amplitude, with bit depth determining dynamic range. Common bit depths are 16-bit (CD quality) and 24-bit (professional audio).
You can manipulate, store, and transmit the resulting digital audio waveforms without quality loss. Modern digital audio workstations (DAWs) display these waveforms visually, allowing precise editing and processing.
The Relationship Between Waveforms And Human Hearing
Human hearing interprets audio waveforms based on their physical properties. Our ears detect frequencies between approximately 20 Hz and 20 kHz, with sensitivity varying across this range. We perceive amplitude changes logarithmically rather than linearly, which is why decibels use a logarithmic scale.
Complex waveforms with multiple frequency components create the rich timbres we associate with different instruments and voices. Our brains process these waveform characteristics to identify sound sources and extract meaningful information.
Psychoacoustic principles explain why certain waveform modifications affect our perception differently. For example, we're more sensitive to timing differences in lower frequencies and amplitude differences in mid-range frequencies where speech occurs.
Understanding the relationship between waveforms and human perception helps audio engineers make informed decisions about processing, compression, and mixing to create pleasing and effective audio experiences.

2
Essential Properties Of Audio Waveforms
Audio waveforms represent sound visually, allowing us to analyze and manipulate audio signals effectively. These visual representations carry critical information about how sound behaves and how we perceive it.
Amplitude: Understanding Volume And Dynamics
Amplitude refers to the maximum displacement of a waveform from its center line and directly correlates to the perceived loudness of sound. Higher-amplitude waves produce louder sounds, while lower-amplitude waves create quieter sounds.
When examining a waveform display, the vertical axis represents amplitude, typically measured in decibels (dB). Professional audio engineers carefully monitor amplitude to prevent clipping, which occurs when signals exceed the maximum amplitude the system can handle.
Dynamic range describes the difference between the loudest and quietest parts of an audio signal. This range is crucial for creating emotionally impactful music and clear speech recordings.
Key amplitude considerations:
- Peak amplitude: Maximum displacement value
- RMS (Root Mean Square): The average power of the signal
- Headroom: Buffer between average levels and clipping threshold
Frequency: Pitch And Tone Representation
Frequency defines how many complete cycles a waveform completes per second, measured in Hertz (Hz). Higher frequencies create higher-pitched sounds, while lower frequencies produce bass tones. Human hearing generally ranges from 20Hz to 20,000Hz, though this varies by individual and declines with age.
The waveform's wavelength is inversely proportional to its frequency - higher frequencies have shorter wavelengths. When visualizing audio, frequency appears as the horizontal spacing between wave cycles.
Different instruments and voices produce characteristic frequency profiles. A bass guitar primarily generates low frequencies (40-400Hz), while a flute produces higher frequencies (300-2,000Hz).
Frequency bands in audio production:
- Sub-bass: 20-60Hz
- Bass: 60-250Hz
- Low-mids: 250-500Hz
- Mids: 500-2,000Hz
- High-mids: 2,000-4,000Hz
- Highs: 4,000-20,000Hz
Discover Best Audio Gear & Equipment

Phase And Phase Cancellation Explained
Phase represents the position of a waveform at a specific point in time, measured in degrees (0°-360°) or radians. When two identical waveforms align perfectly, they are "in phase" and reinforce each other, increasing amplitude.
Phase cancellation occurs when waveforms are partially or completely out of alignment. When two identical waves are 180° out of phase, they cancel each other completely, resulting in silence. This phenomenon causes many common audio problems.
In stereo recording, phase issues can create thin, weak-sounding mixes or strange spatial effects. Multiple microphones capturing the same source at different distances frequently encounter phase problems.
Phase alignment tools in audio software help identify and correct these issues. Engineers often use correlation meters to ensure proper phase relationships between stereo channels.
Waveform Polarity And Its Impact On Sound
Polarity refers to the direction of a waveform's displacement – whether it initially moves positively (upward) or negatively (downward). Unlike phase, which is relative, polarity is absolute.
A polarity inversion completely flips the waveform upside down, with positive values becoming negative and vice versa. This 180° polarity flip sounds identical in isolation but can cause severe cancellation problems when combined with other signals.
Many audio interfaces and microphones include polarity inversion switches (often labeled "Ø") to correct potential issues when using multiple microphones. This simple correction can dramatically improve sonic clarity.
Common polarity issue scenarios:
- Multi-microphone drum recordings
- DI bass combined with microphone signals.
- Room mics mixed with close mics.
- Incorrectly wired balanced cables
3
Reading And Interpreting Waveforms In DAWs
Understanding how to read waveforms in Digital Audio Workstations (DAWs) enables producers and engineers to make more informed decisions about editing and mixing. Visual representations of audio provide immediate feedback on amplitude, frequencies, and potential issues.
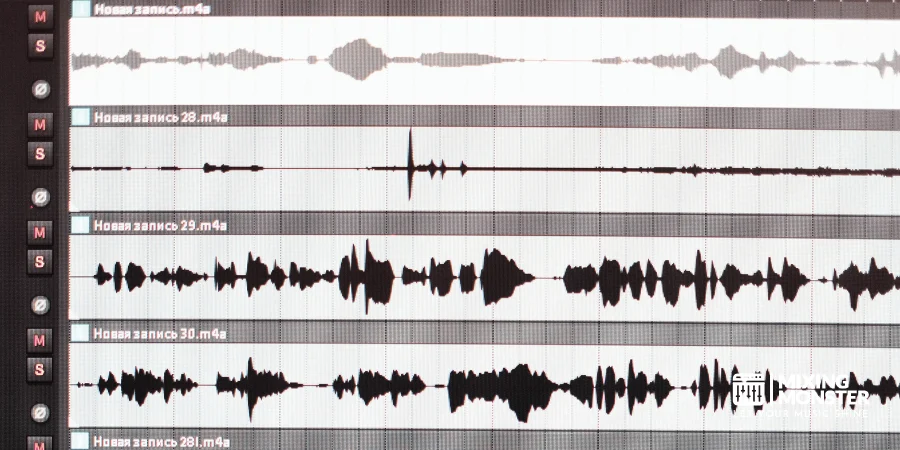
Waveform Displays In Popular Audio Editing Software
Different DAWs represent audio waveforms in slightly different ways. Pro Tools displays waveforms with detailed amplitude representation and offers multiple visualization modes for different editing tasks.
Logic Pro provides color-coded waveforms that help distinguish between different frequency ranges, making it easier to identify problematic areas. The vertical axis in waveform views represents positive and negative voltage swings in the analog electrical signal.
Ableton Live offers both compact and detailed waveform views, and you can toggle between them to suit different workflow needs. FL Studio offers customizable waveform colors and transparency options that you can adjust based on personal preference.
Most modern DAWs also offer spectrogram views alongside traditional waveforms, providing frequency information that plain waveforms cannot display.
Identifying Audio Problems Through Visual Inspection
Visual inspection of waveforms can quickly reveal common audio issues:
- Clipping: Flat tops on waveforms indicate distortion from overloaded signals
- DC offset: Waveforms that aren't centered on the zero line
- Noise: Consistent "fuzz" in quiet sections where there should be silence
- Phase issues: Asymmetrical waveforms or unusual patterns
The raw waveform displays amplitude profiles including attack, decay, sustain, release characteristics, and modulation like tremolo or LFO effects. When examining vocal recordings, uneven waveform heights might indicate inconsistent performance dynamics.
Background noise appears as low-level activity between intended sounds, while digital artifacts often display as unexpected spikes or rectangular patterns that don't match natural audio behavior.
Your Song Mixed & Mastered By Mixing Monster


Zoom Levels And Time Scale Considerations
Proper zoom-level selection dramatically affects what information appears in waveforms. Zooming out provides an overview of dynamics and arrangement structure, showing overall song flow and major transitions.
Zooming in reveals transient details, making it possible to identify percussion hits and edit with sample-level precision. Many engineers use different zoom levels for different tasks:
- Macro view (entire song): For arrangement decisions
- Section view (verse/chorus): For balancing parts
- Micro view (individual notes): For detailed editing work
The time scale also affects how frequencies appear – lower frequencies require more time to display complete cycles. This means bass-heavy content needs wider zoom levels to evaluate properly, while high-frequency details become visible at closer zoom levels.
Color-Coding And Advanced Visualization Tools
Modern DAWs offer sophisticated visualization options beyond basic waveforms. Spectral displays color-code frequencies, making it easier to identify specific instruments or problems within a mix. These tools are particularly valuable for surgical EQ and noise removal.
Audio waveforms are the backbone of sound editing, and advanced visualization enhances their utility. Heat maps show energy concentration, using warmer colors for higher-amplitude areas and cooler colors for quieter sections.
Transient markers automatically identify the attack portions of sounds, supporting drum editing and sample-replacement workflows. Some DAWs include softness controls for waveform edges, helping distinguish sharp transients from more gradual onsets.
RMS overlays display average energy alongside peak levels, providing a more accurate representation of perceived loudness than waveforms alone. These advanced tools transform simple waveform data into actionable insights for more precise audio manipulation.
4
Waveform Manipulation Techniques For Audio Editors
Audio waveform manipulation forms the backbone of professional audio editing, allowing editors to shape sound with precision and creativity. These techniques enable both corrective and artistic approaches to audio production through direct interaction with sound's visual representation.
Cutting, Splicing, And Crossfading Waveforms
The most fundamental waveform editing techniques involve precisely manipulating audio segments. Trimming changes the length of an audio clip by removing unwanted portions at the beginning or end of a recording. This eliminates false starts, breaths, or room noise.
Splicing allows editors to remove middle sections or combine multiple audio segments. When joining audio clips, abrupt transitions can create clicks or pops. Crossfading solves this by gradually decreasing one clip's amplitude while increasing the other's.
Best practices for clean splices include:
- Cutting at zero-crossing points where the waveform intersects the center line
- Using short crossfades (5-20ms) for dialogue
- Applying longer crossfades (50-500ms) for music to ensure smooth transitions
Modern DAWs offer tools for seamless splicing, including automatic crossfades and snap-to-grid functionality. These features make precise waveform editing accessible even for beginners.
Normalization And Peak Limiting
Normalization adjusts an audio waveform's amplitude to a target level. This process increases the overall volume without changing the dynamic relationship between loud and soft parts. Engineers typically normalize to -0.3 dB rather than 0dB to prevent digital clipping.
Peak limiting, a more aggressive approach, restricts audio signals from exceeding a specified threshold. Unlike normalization, limiting affects only the portions of audio that exceed the threshold, compressing peaks while leaving quieter sections untouched.
Both techniques influence the visual representation of waveforms:
|
Technique |
Effect on Waveform |
Common Use Case |
|
Normalization |
Scales entire waveform uniformly |
Matching levels between different recordings |
|
Peak Limiting |
Flattens peaks above threshold |
Preventing digital clipping, increasing perceived loudness |
These processes are essential for precise audio editing, particularly when preparing final mixes for distribution across multiple platforms.
Related Articles
Time-Stretching And Pitch-Shifting Effects On Waveforms
Time-stretching alters audio duration without changing pitch, while pitch-shifting modifies frequency without affecting duration. These techniques directly manipulate waveform properties, creating new sound characteristics from existing recordings.
Modern algorithms use phase vocoding or granular synthesis to minimize artifacts. Time-stretching quality depends on the material—percussive content typically degrades more than sustained sounds like strings or pads.
Time-stretching visibly changes waveform density. Stretching elongates wave cycles and increases the space between transients, while compression condenses these elements. Pitch-shifting alters the frequency content, changing the waveform's vertical oscillation patterns.
Common applications include:
- Matching tempo between audio elements without altering their tonal characteristics
- Correcting vocalist pitch while preserving natural timing
- Creating special effects by extreme stretching or pitch manipulation
- Fitting dialogue or music cues to specific time constraints in video productions
Creative Waveform Editing For Sound Design
Sound designers leverage waveform editing for creative purposes beyond technical corrections. By manipulating audio at the sample level, they create unique sounds impossible to capture naturally.
Reversing waveforms produces backward audio with distinctive attack and decay characteristics—useful for creating otherworldly ambiances or transition effects. Waveform editing is essential for sound designers crafting original material.
Audio sculpting through waveform manipulation includes:
- Isolating and enhancing specific frequency bands
- Creating rhythmic patterns through waveform copying and repetition
- Generating textures by layering processed waveforms
- Designing impact sounds by combining attack transients with different sustain portions
Visual feedback from the waveform display guides these creative decisions. Synchronizing visual elements with audio waveform data extends these techniques into multimedia applications, where sound and image can respond to each other dynamically.

5
Advanced Waveform Analysis Tools
Modern audio analysis requires sophisticated tools that go beyond basic waveform displays. Today's professionals rely on complex visualization technologies that reveal detailed spectral information, phase relationships, and temporal characteristics of audio signals.
Spectrum Analyzers And FFT Displays
Spectrum analyzers utilize Fast Fourier Transform (FFT) algorithms to convert time-domain audio signals into frequency-domain representations. These powerful tools break down complex waveforms into their component frequencies, displaying amplitude across the audible spectrum.
Audio Scope and Spectrum Analyzer modules offer comprehensive views of demodulated audio waveforms. Professional audio engineers rely on FFT displays to identify problematic frequencies, optimize EQ settings, and ensure balanced mixes.
Many DAWs include built-in spectrum analysis with adjustable resolution settings. Higher FFT sizes (1024, 2048, or 4096) provide more detailed frequency resolution while sacrificing some temporal precision.
Real-time capabilities let engineers see how plugins affect a waveform during processing. This immediate feedback helps with precise adjustments to compression, EQ, and other effects.
3D Waveform Visualization Technology
Three-dimensional waveform visualization represents the next evolution in audio analysis. These tools combine time, frequency, and amplitude data into interactive 3D models that reveal previously hidden relationships in complex audio material.
Modern visualization platforms support animated waveform capabilities that transform static displays. A high-quality audio visualizer lets engineers see frequency distribution and energy in real time. After Effects compositions can be particularly effective for creating custom 3D waveform visualizations with precise control over every aspect.
Creating animated soundwaves in After Effects typically begins with a solid layer that reacts to audio amplitude data. The Effects Controls panel offers options to customize frequency sensitivity, amplitude scaling, and visual styling.
Advanced 3D visualizations often incorporate spectrogram displays that map frequency against time, with color intensity representing amplitude. These waterfall-style displays excel at revealing frequency patterns and transitions that traditional 2D views might miss.
AI-Powered Waveform Analysis
Artificial intelligence has revolutionized waveform analysis by automating complex tasks that previously required expert human interpretation. Machine learning algorithms can now identify patterns, anomalies, and characteristics within audio waveforms with remarkable accuracy.
Modern AI tools can automatically detect clicks, pops, and distortion artifacts that might be difficult to spot visually. Some advanced systems can even suggest appropriate repair techniques based on the specific audio problem they identify.
Neural networks trained on vast audio datasets can classify sound types, separate overlapping sources, and enhance specific elements within complex mixtures. This capability is invaluable for forensic audio analysis and restoring damaged recordings.
iZotope RX exemplifies AI-powered audio analysis with spectral repair tools and intelligent audio processing. The software uses machine learning to identify and isolate unwanted sounds while preserving the integrity of desired audio content.
Comparing Vectorscopes, Phase Meters, And Traditional Waveforms
Vectorscopes display the relationship between stereo channels on an X-Y plot, revealing phase correlation and stereo image width. This circular display helps engineers assess stereo balance and identify potential mono compatibility issues that simple waveforms cannot show.
Phase meters provide a direct numerical measurement of phase correlation between channels. Values near +1.0 indicate strong positive correlation (mono compatibility), while negative values warn of potential phase cancellation issues when summed to mono.
Traditional amplitude waveforms excel at showing dynamic range, transient information, and overall signal level. They provide an intuitive view of audio energy over time but lack detailed frequency information that Fourier transform analysis can reveal.
The Waveform plugin for OBS shows how these visualization types can be combined in a single interface, displaying the frequency spectrum alongside traditional waveform displays. This multi-modal approach provides comprehensive audio monitoring capabilities.

6
Troubleshooting Common Audio Issues Using Waveforms
Audio waveforms visually represent sound and can help you identify and fix common audio problems. By learning to read waveform patterns correctly, you can diagnose and solve most common audio issues before they affect your final production.
Identifying And Fixing Clicks And Pops
Clicks and pops appear in waveforms as sharp, vertical spikes that stand out from the regular audio pattern. These unwanted artifacts often result from editing splices, digital errors, or physical damage to original recordings.
To identify these issues:
- Look for abnormally tall, thin spikes in otherwise normal waveform sections
- Listen at reduced playback speed to confirm the location of the click or pop
- Zoom in to examine the exact point where the disturbance occurs
Cleaning techniques include using the pencil tool to redraw the waveform at the affected point, applying specialized click removal plugins, or creating small crossfades at edit points.
For persistent clicks, try isolating the problematic frequency with a notch filter. Most modern DAWs offer specialized tools specifically designed for click and pop removal that can analyze and repair these issues automatically.
Detecting And Removing Unwanted Noise
Background noise appears in waveforms as consistent low-level activity even during supposed "silent" sections. This noise floor is visible as small, grainy patterns rather than a flat line during quiet passages.
When examining noise problems:
- Identify silent portions where only noise is present
- Measure the average amplitude of the noise floor
- Note any frequency patterns or rhythmic characteristics
Effective noise reduction requires a "noise print" - a sample of just the noise without desired audio. Most noise reduction tools analyze this noise print and then subtract similar patterns from the entire recording.
Spectral editing tools show frequencies over time, making it easier to identify and remove specific noise types like hums (horizontal lines) or hisses (diffuse high-frequency content). Waveform displays can help identify the boundaries between noise and actual content, ensuring you don't remove essential audio elements.
Recognizing Clipping And Distortion Patterns
Clipping occurs when audio exceeds the maximum amplitude your system can handle, flattening peaks in the waveform. These flat tops represent distortion where the audio signal has been cut off.
Visual indicators of clipping include:
- Squared-off waveform tops instead of natural rounded peaks
- Waveforms that touch or exceed the maximum amplitude line
- Consistent patterns of flat peaks across multiple sections
Digital clipping is particularly problematic because, unlike analog distortion, it sounds harsh and unpleasant. To fix clipped audio, first reduce the overall gain to prevent further clipping. For already clipped recordings, specialized restoration tools can attempt to reconstruct the missing peaks.
Prevention is always better than cure. Monitor your levels during recording and maintain at least 6dB of headroom. Many DAWs include clipping indicators that alert you when signals approach problematic levels, helping you avoid distortion before it occurs.
Using Waveforms To Spot Timing And Sync Problems
Audio sync issues often appear as misaligned waveform patterns between tracks that should be synchronized. When examining multiple audio sources or audio-video synchronization, these visual misalignments indicate timing problems.
Common sync issues revealed by waveforms:
- Offset identical patterns between different audio tracks
- Gradually increasing misalignment (indicating drift)
- Audio events not aligning with corresponding video events
To fix these problems, first establish a reference point such as a clap or distinct sound that should align across all tracks. You can correct misaligned waveforms by shifting tracks until their patterns align properly.
For more complex issues, you may need time-stretching or compression to maintain sync throughout longer recordings. Some editing systems may show waveforms that appear out of sync with what you hear. In these cases, rebuilding peak files by clearing the media cache can often resolve display inconsistencies without affecting the actual audio.

7
Key Takeaways On Audio Waveforms
Audio waveforms are visual representations of sound that display changes in amplitude over time. They serve as the backbone of sound editing and engineering, providing a way to analyze and manipulate audio.
The basic principle behind waveforms is visualizing the air-molecule vibrations that create sound. This graphical representation lets audio engineers precisely identify and modify specific elements within a sound.
Common waveform types include:
- Sine waves (pure tones)
- Square waves (rich in harmonics)
- Triangle waves (softer than square waves)
- Sawtooth waves (bright and buzzy)
In audio editing software, waveforms help identify important audio characteristics. The tops and bottoms of waveforms represent the highest amplitudes, while crossings of the center line indicate zero amplitude.
Understanding waveform shapes can reveal a lot about sound quality. Heavily compressed audio typically shows a "brick-like" appearance, while dynamic recordings display more variation in amplitude.
Waveforms enable precise editing tasks such as:
- Cutting and splicing audio at exact points
- Identifying unwanted noise
- Applying effects to specific sections
- Analyzing frequency content
Modern audio software enhances waveform functionality with color-coding and additional visualization options, making audio editing more intuitive and efficient.

Frequently Asked Questions
1
How can one visualize an audio file as a waveform?
You can visualize audio files as waveforms using digital audio workstations (DAWs) like Audacity, Adobe Audition, or GarageBand. These programs automatically display the audio as a waveform when importing a file.
Most modern DAWs let you adjust the waveform display by increasing the height or changing the color scheme for better visibility. When recording audio tracks, the waveform grows larger as input signal strength increases.
For web applications, technologies like Web Audio API can render audio waveforms directly in browsers without additional plugins.
2
What tools are available for generating audio waveforms for video production?
Video editing software such as Adobe Premiere Pro, Final Cut Pro, and DaVinci Resolve includes built-in audio waveform visualization. These tools display audio alongside video tracks in the timeline.
Specialized tools like WaveVisual can generate custom animated waveforms for video content. This type of audio waveform generator is especially useful for explainer videos where visual emphasis matters.
Some creators use Shotcut, which lets you add audio waveform visualization overlays directly to video files, enhancing the visual representation of sound in music videos or speech in text-to-speech applications.
3
How can you generate audio waveforms programmatically in Flutter?
Flutter developers can generate audio waveforms using packages like flutter_audio_waveforms or audio_waveforms. These packages provide customizable widgets that visualize audio data in real time.
To implement this functionality, developers need to process audio files to extract amplitude data, then pass this data to the waveform widget for rendering. You can do the processing using Flutter's FFI (Foreign Function Interface) with native audio processing libraries.
For real-time waveform generation from microphone input, Flutter applications can use the microphone package combined with audio processing to update the waveform display continuously.
4
What are the differences between the four basic waveforms?
Sine waves are the purest form of sound, with a smooth, rounded appearance, and contain only a fundamental frequency with no harmonics. They produce a clean, pure tone ideal for testing.
Square waves alternate abruptly between maximum and minimum values, creating a "boxy" appearance. They contain odd harmonics and produce a hollow, clarinet-like sound commonly used in retro video games.
Triangle waves rise and fall at a constant rate, creating a zig-zag pattern. With fewer harmonics than square waves, they sound softer and are often used for bass sounds in electronic music.
Sawtooth waves rise gradually and drop suddenly (or vice versa), containing both even and odd harmonics. They produce the richest harmonic content and create bright, buzzy sounds ideal for synthesized strings and brass.
5
Which software allows for the creation of audio waveforms without charge?
Audacity is the most popular free, open-source audio editor that displays waveforms and allows detailed editing and analysis. It works on Windows, macOS, and Linux systems.
LMMS (Linux MultiMedia Studio) offers free waveform visualization and generation for music production; despite its name, it works across multiple platforms.
For web-based solutions, TwistedWave Online provides free basic waveform editing capabilities without requiring any software installation. It's particularly useful for quick edits or when working on shared computers.
6
What methods are used to generate sound waves online?
The Web Audio API lets developers create and manipulate audio waveforms directly in web browsers. This JavaScript API can generate various waveform types and apply real-time processing.
Online text-to-speech services convert text input into audio waveforms using speech synthesis algorithms. These services often display the generated waveform alongside the audio output.
Browser-based synthesizers use oscillators to generate different waveforms that users can adjust through virtual interfaces. Users can modify parameters like frequency, amplitude, and waveform type to create custom sounds.
Cloud-based audio platforms like Soundation or BandLab offer online DAW functionality, including waveform visualization and editing, accessible through web browsers.
Related Articles
You Might Also Be Interested In